Sharetraderator
An AI-assisted, paper-trading research tool for ASX shares. Every trading day it pulls end-of-day prices, computes transparent quantitative signals in Python, asks Claude to turn those signals into a structured, risk-bounded recommendation, and journals everything to a database — so months later you can audit whether the system actually adds value. It never places a real order.
Problem Solved
Retail trading decisions are usually a mix of gut feel and whatever the finance press said that morning, and nobody keeps score. Sharetraderator replaces that with a disciplined daily loop: the same signals, the same risk rules, the same conservative prompt, every single day — and a permanent journal of what was recommended, why, and what the signals looked like at the time. The goal isn't a money printer; it's an honest, measurable answer to "does this process beat doing nothing?"
It's also a working study in where LLMs belong in a quantitative pipeline: Python does all the arithmetic, and Claude only reasons over pre-computed numbers — the division of labour that plays to each side's strengths.
This tool is a personal research project and is not financial advice. It places no real orders; all outputs are paper-trading recommendations for manual review.
Key Features
Daily Automated Analysis Run
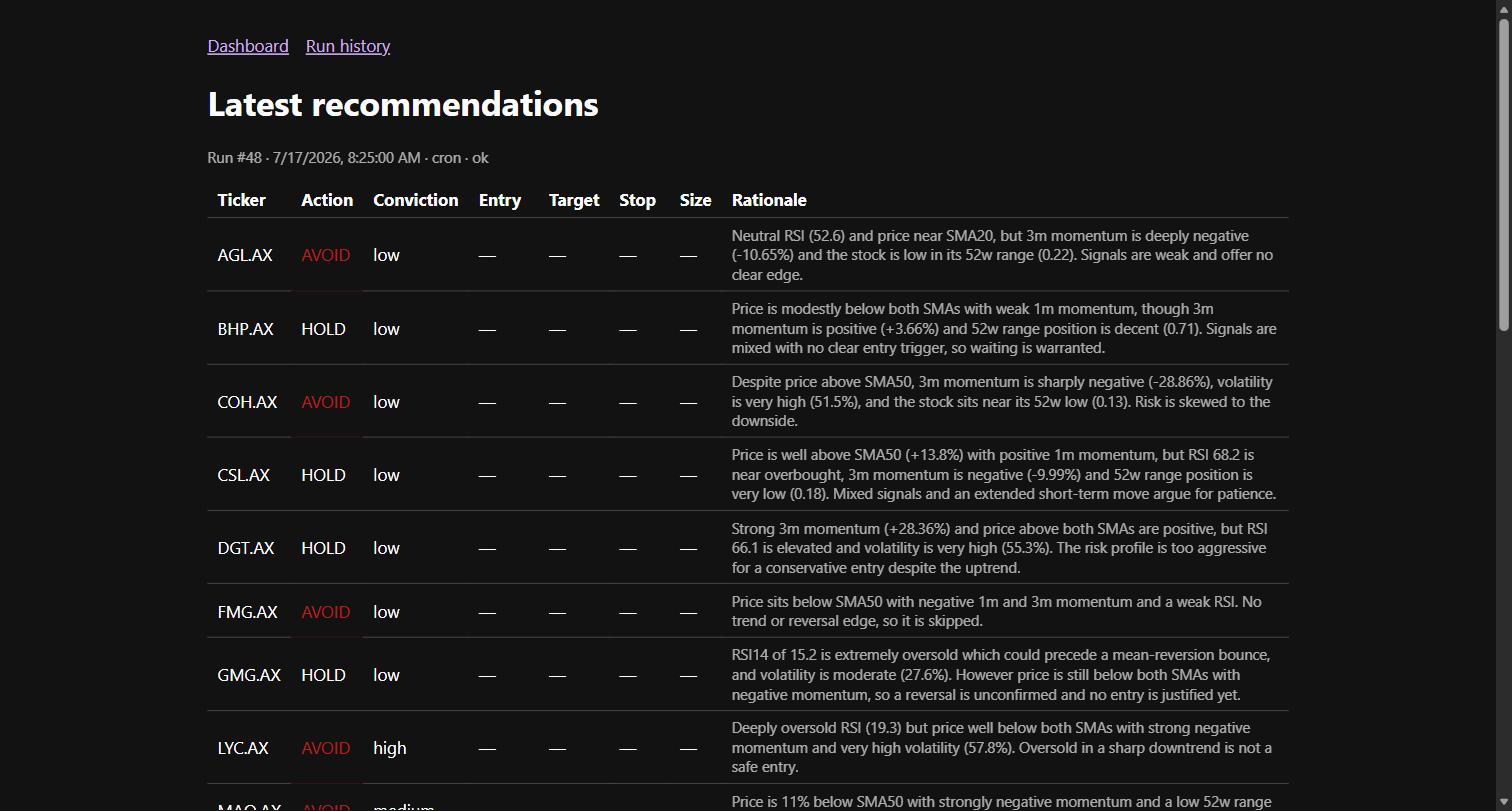
A Vercel cron fires shortly after ASX close. A Python function fetches end-of-day data for a ~23-ticker watchlist, computes RSI, moving averages, momentum, volatility and 52-week range position in pandas, and sends only those derived signals to Claude. The model returns structured JSON: action (BUY / HOLD / AVOID), conviction, entry range, target, stop, position size, and a plain-English rationale.
Code-Enforced Risk Limits
Whatever the model returns is clamped back inside hard limits defined in code — maximum position size, stop-loss discipline, portfolio exposure caps. A bad model output cannot exceed the risk framework, because enforcement happens after the response, in Python, not in the prompt.
A Deliberately Conservative Bias
The system prompt and rule set prefer doing nothing over a marginal trade. In practice most days most tickers come back HOLD or AVOID with a reasoned explanation — which is exactly the point. A recommendation engine that mostly says "no trade" is a feature, not a failure.
Full Audit Journal
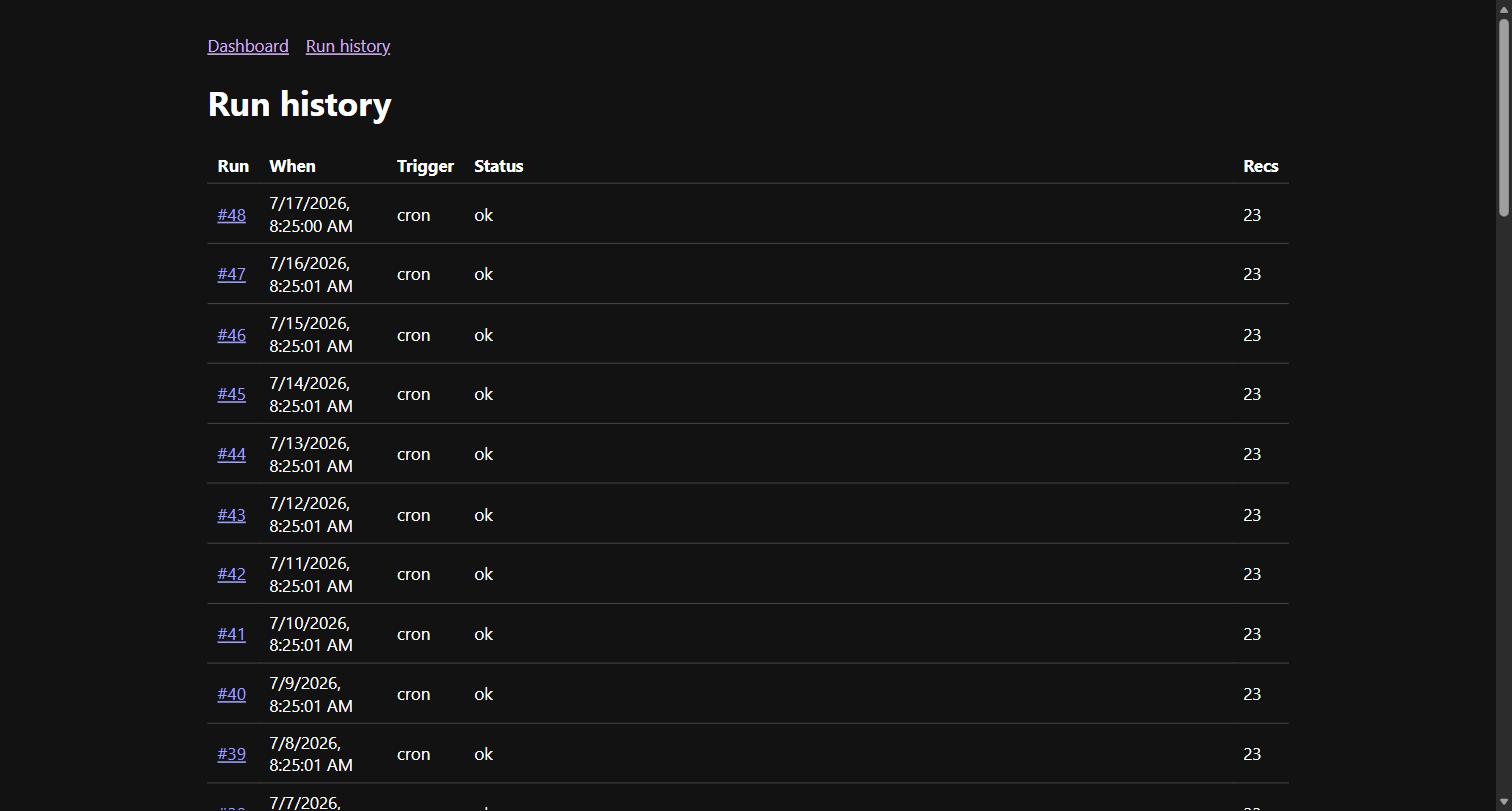
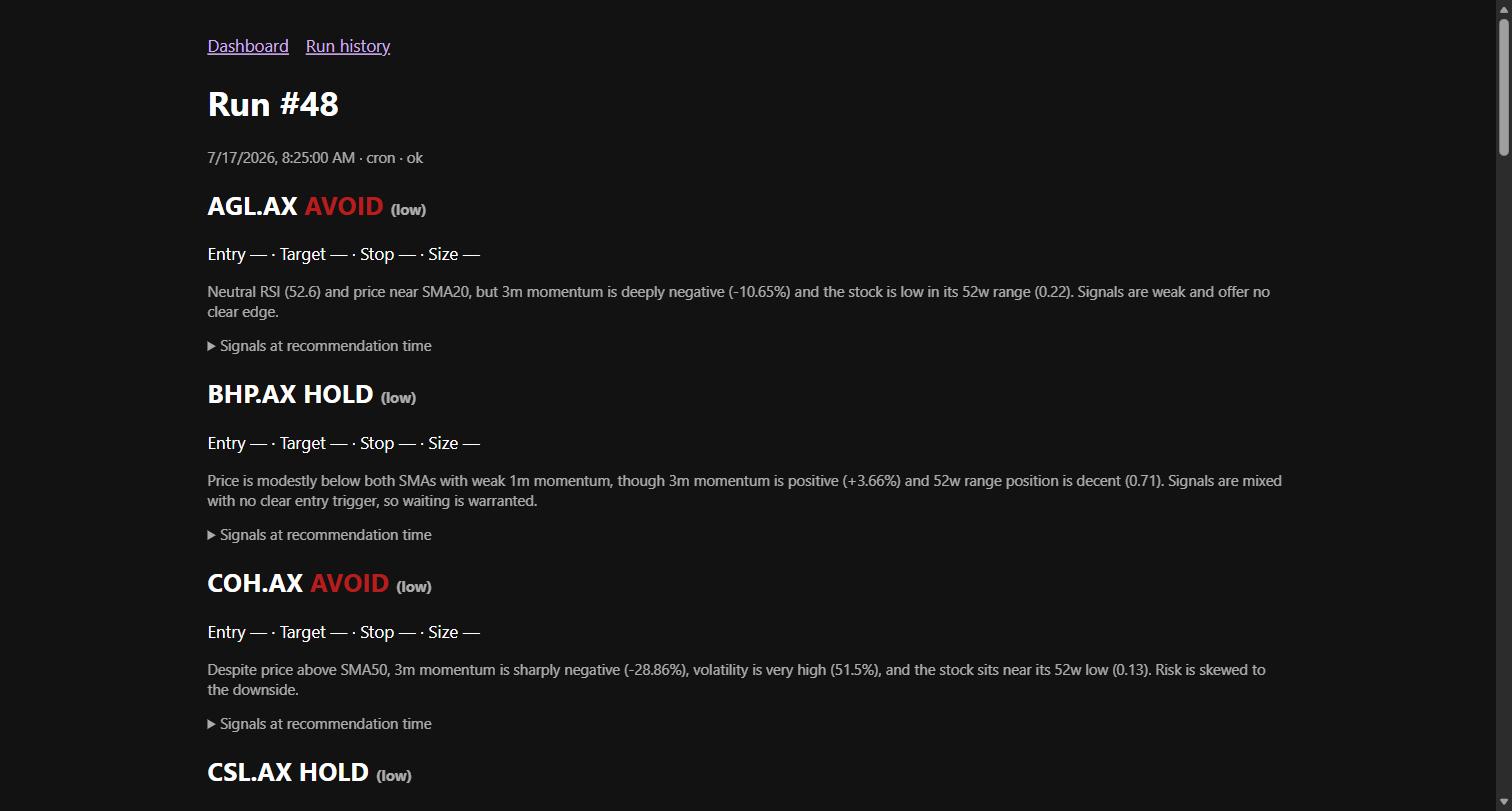
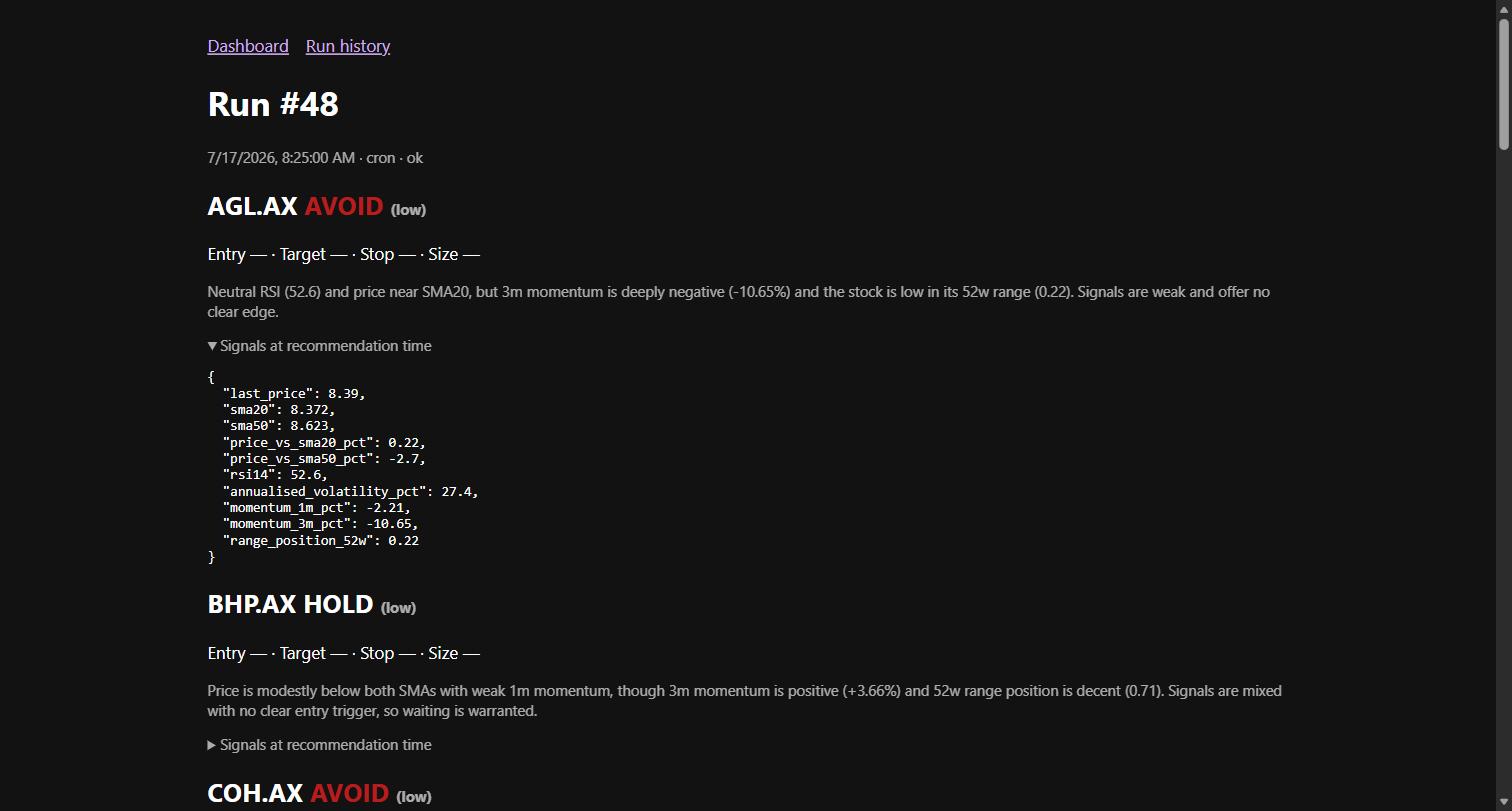
Every run stores every recommendation together with the exact signal values that produced it. The read-only dashboard renders the latest run, the full run history, and per-ticker detail with the raw signal JSON one click away. Recommendation-vs-outcome analysis is possible months later because nothing is ever overwritten.
Honest Backtesting
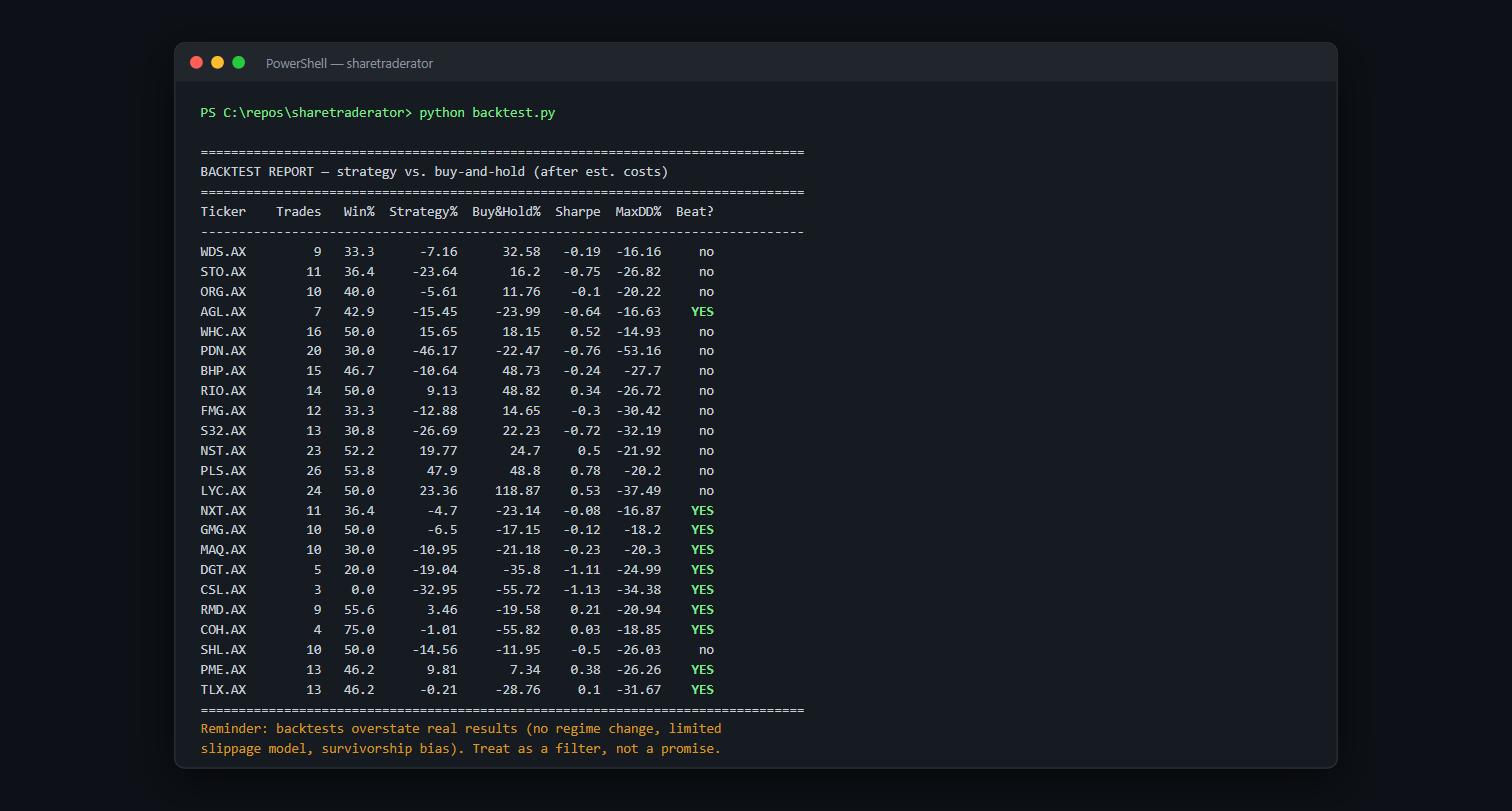
A separate rule-based backtest engine (no API calls, so free to iterate) tests the signal ruleset against two years of history per ticker, after estimated brokerage and slippage, and reports strategy vs. buy-and-hold with Sharpe and max drawdown. It prints its own limitations at the bottom of every report — survivorship bias, simplistic slippage, no regime modelling — because a backtest that flatters itself is worse than none.
Architecture
Architecture Overview
Python does all the arithmetic; the LLM never touches raw prices. yfinance end-of-day data flows into pandas to produce RSI14, SMA20/50, 1m/3m momentum, annualised volatility, and 52-week range position. Those signals go to the Claude API, and structured JSON comes back — with markdown-fence stripping, truncation detection, and a defensive error shape on parse failure. Risk limits are then enforced in Python, after the response.
Everything is journaled immutably — recommendations stored together with the exact input signals that produced them — and a read-only Next.js dashboard renders what the pipeline journaled, computing nothing itself.
- Data layer: Python/pandas over yfinance end-of-day data — RSI14, SMA20/50, momentum, volatility, 52-week range position
- Analysis layer: Claude API — signals in, structured JSON out, with defensive parsing
- Risk enforcement: post-response clamping of position size, targets and stops against hard limits in config
- Journal: SQLite locally, Neon Postgres in the cloud; recommendations and input signals stored together, immutably
- Dashboard: read-only Next.js app on Vercel
- Ops: daily Vercel cron hitting a secret-protected Python endpoint; push-to-main auto-deploys; watchlist and risk settings in a database settings table
Key Decisions
Python computes, Claude reasons
LLMs are unreliable at arithmetic and excellent at weighing evidence. Splitting the pipeline at that boundary means every number is deterministic and testable, and the model's job is reduced to structured judgement over clean inputs.
Trust, but clamp
Risk limits are enforced in code after the model responds, not just requested in the prompt. Prompts are suggestions; enforce_risk() is law.
Paper trading only, forever-auditable
No order execution path exists. Instead, the system invests in the journal — because the interesting question was never "can an AI pick stocks?" but "can I prove whether this process adds value?"
Screenshots
Interested in something similar?
We scope, design, and ship data and AI tools that solve the problems your team actually has.
Let's Talk